Trading with Engulfing Candlesticks: Main Talking Points
Engulfing patterns in the forex market provide a useful way for traders to enter the market in anticipation of a possible reversal in the trend. This article explains what the engulfing candle pattern is, the trading environment that gives rise to the pattern, and how to trade engulfing candlesticks in forex.Keep reading for information on:
- What is an engulfing candlestick and how do they signal a reversal of current trends in the market?
- There are two engulfing patterns to look out for: bullish engulfing and bearish engulfing patterns.
- Engulfing candle trading strategies
What is an Engulfing Candlestick?
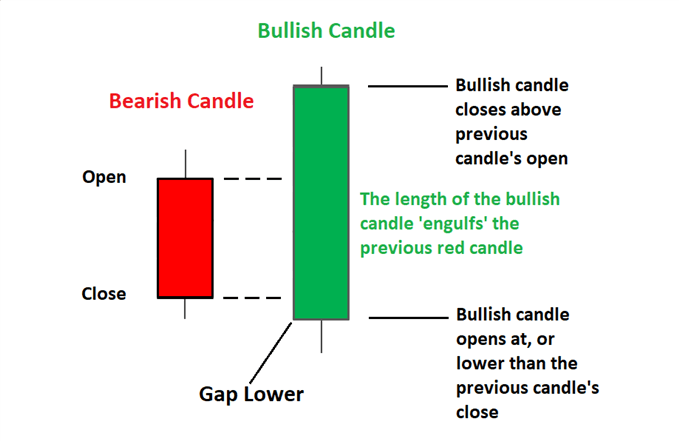
Engulfing candles tend to signal a reversal of the current trend in the market. This specific pattern involves two candles with the latter candle ‘engulfing’ the entire body of the candle before it. The engulfing candle can be bullish or bearish depending on where it forms in relation to the existing trend. The image below presents the bullish engulfing candle.
Unfamiliar with candlestick charts? Read: How to Read a Candlestick Chart
Types of Forex Engulfing Patterns
There are two engulfing candle patterns: bullish engulfing pattern and the bearish engulfing candle.1) Bullish engulfing pattern
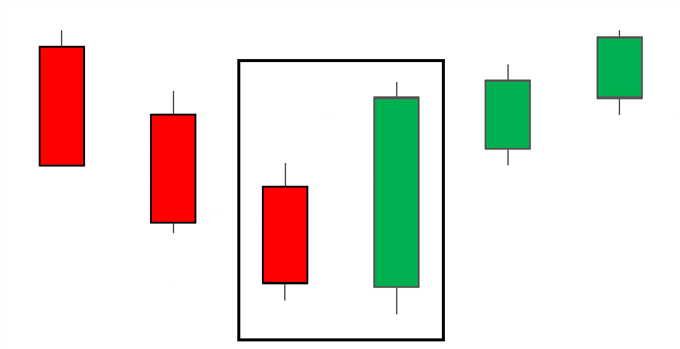
The bullish engulfing candle provides the strongest signal when appearing at the bottom of a downtrend and indicates a surge in buying pressure. The bullish engulfing pattern often triggers a reversal of an existing trend as more buyers enter the market and drive prices up further. The pattern involves two candles with the second candle completely engulfing the ‘body’ of the previous red candle.
Interpretation: Price action must show a clear downtrend when the bullish pattern appears. The large bullish candle shows that buyers are piling into the market aggressively and this provides the initial bias for further upward momentum. Traders will then look for confirmation that the trend is indeed turning around by making use of indicators, key levels of support and resistance and subsequent price action after the engulfing pattern.
 2) Bearish engulfing pattern
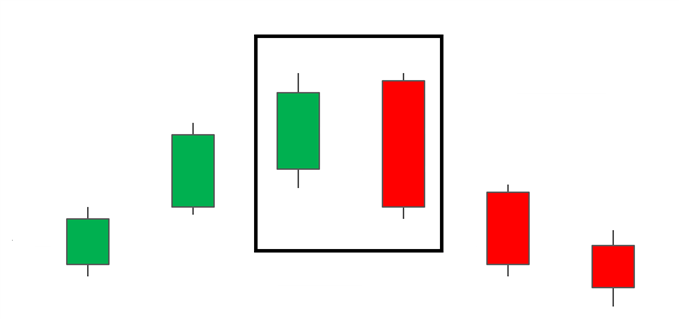
The bearish engulfing pattern is simply the opposite of the bullish pattern. It provides the strongest signal when appearing at the top of an uptrend and indicates a surge in selling pressure. The bearish engulfing candle often triggers a reversal of an existing trend as more sellers enter the market and drive prices down further. The pattern involves two candles with the second candle completely engulfing the ‘body’ of the previous green candle.
Interpretation: Price action must show a clear uptrend when the bearish pattern appears. The large bearish candle shows that sellers are piling into the market aggressively and this provides the initial bias for further downward momentum. Traders will then look for confirmation that the trend is indeed turning around by making use of indicators, levels of support and resistance, and subsequent price action that occurs after the engulfing pattern.

Why are Engulfing Candles Important for Traders?
Engulfing candles assist traders to spot reversals, indicate a strengthening trend, and assist traders with an exit signal:- Reversals: Spotting reversals are self-explanatory – it allows the trader to enter a trade at the best possible level and ride the trend to completion.
- Trend continuation: Traders can look to the engulfing pattern to support the continuation of the existing trend, for example, spotting a bullish engulfing pattern during an uptrend provides more conviction that the trend will continue.
- Exit strategy: The pattern can also be used as a signal to exit an existing trade if the trader holds a position in the existing trend which is coming to an end.
Engulfing Candle Trading Strategies
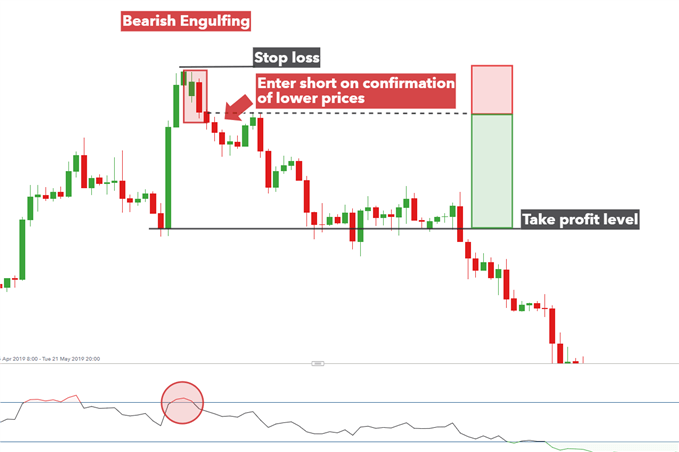
Using the Engulfing Candle Reversal StrategyTraders can look to trade the bearish engulfing pattern by waiting for confirmation of the move by observing subsequent price action or to wait for a pullback before initiating a trade.
See below for guidance on how to trade the engulfing candlestick pattern observed on the GBP/USD four-hour chart.

- Entry: Look for a successful close below the low of the bearish engulfing candle. Alternatively, traders can look for a momentary retracement (towards the dotted line) before entering a short trade.
- Stop: Stops can be placed above the swing high where the bearish engulfing pattern occurs.
- Target / take profit level: The target can set at a previous level of support while ensuring a positive risk to reward ratio. The risk to reward ratio is depicted by the green and red rectangles.
Using the Engulfing Candle When Trend Trading
Engulfing candles don’t always have to appear at the end of a trend. When viewed within a strong trend, traders can glean information from the candle pattern pointing towards continued momentum in the direction of the existing trend.
For example, the below chart shows a strong uptrend in the S&P 500 with the appearance of multiple engulfing patterns (in the direction of the trend) adding more conviction to long trades. Traders can enter a long trade after observing a close above the bullish candle.
Furthermore, this example includes the presence of a bearish engulfing pattern (red rectangle) that appeared at the top of the trend, signaling a potential reversal. However, subsequent price action did not validate this move as successive candles failed to close below the low of the bearish engulfing candle and the market continued higher – thus underscoring the importance of validating the pattern.

No comments:
Post a Comment